LoginMetrics for Churches without Campuses
The LoginMetrics python script produces a formatted report showing the total numbers of logins for the past 30 days whether the login was on a mobile device or on a web browser.
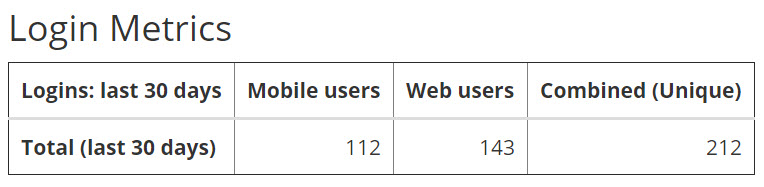
Sample LoginMetrics Report
Note
This article describes the python script needed by a church that does not have multiple campuses. If you use the Campus feature of TouchPoint, see LoginMetrics for Churches with Campuses.
Create the LoginMetrics Script
- Step 1
Go to Administration > Setup > Special Content and select the Python Scripts tab.
- Step 2
Click the green + New Python Script File button and enter the name of the file as
LoginMetricsand press Submit.- Step 3
Copy all of the code below and then paste it into the new script file and press the blue Save Python Script button.
1 2 3 4 5 6 7 8 9 10 11 12 13 14 15 16 17 18 19 20 21 22 23 24 25 26 27 28 29 30 31 32 33 34 35 36 37 38 39 40 41 42 43 44 45 46 47 48 49 50 51 52 53 54 55 56 57 58 59 60 61 62 63 64 65 66 67 68 69 70 71 72 73 74 75 76 77 78 79 80 81 82 83 84 85 86 87 88 89 90 91 92 93 94 95 96 97 98 99 100 101 102 103 104 105 106 107 108 109 110 111 112 113 114 115 116 117 118 119 120 121 122 123 124 125 126 127 128 129 130 131 | #roles=Admin from System.DateTime import Now today = Now MonthAgo = today.AddDays(-30).Date strMo = str(today.Month) strToday = today.ToString('d') strMonthAgo = MonthAgo.ToString('d') groups = [ ["Total last 30 days", strMonthAgo] ] churches = [ ["Total (last 30 days)", 0] ] appquery = ''' SELECT count(distinct p.peopleid) as Count FROM dbo.MobileAppDevices mad INNER JOIN dbo.People p on mad.PeopleId = p.PeopleId WHERE mad.lastseen > '{}' AND isnull(p.CampusId,0) IN ({}) ''' webquery = ''' WITH loginUsers (userid) AS ( SELECT distinct userid FROM dbo.ActivityLog log WHERE ActivityDate > '{}' AND Activity like '%logged in' ) SELECT count(distinct lu.userid) as Count FROM loginUsers lu INNER JOIN dbo.Users u ON lu.Userid = u.UserId INNER JOIN dbo.People p ON u.PeopleId = p.PeopleId WHERE isnull(p.campusid,0) IN ({}) ''' combinedquery = ''' WITH loginUsers (userid) AS ( SELECT distinct userid FROM dbo.ActivityLog log WHERE ActivityDate > '{}' AND Activity like '%logged in' ) ,webUsers (web_userid) AS ( SELECT lu.UserId FROM loginUsers lu INNER JOIN dbo.Users u ON lu.Userid = u.UserId INNER JOIN dbo.People p ON u.PeopleId = p.PeopleId WHERE isnull(p.campusid,0) IN ({}) ) ,appUsers (app_userid) AS (SELECT distinct userid FROM dbo.MobileAppDevices mad INNER JOIN dbo.People p on mad.PeopleId = p.PeopleId WHERE mad.lastseen > '{}' AND isnull(p.CampusId,0) IN ({}) ) SELECT count(*) as Count FROM webUsers FULL OUTER JOIN appUsers ON webUsers.web_userid = appUsers.app_userId ''' class Row: def __init__(self, name): self.name = name self.cols = [] Data.rows = [] # create a list of rows for church in churches: row = Row(church[0]) # Mobile app logins rowcolquery = appquery.format(strMonthAgo, church[1]) data = q.QuerySql(rowcolquery) for i in data: if i.Count is not None: row.cols.append(i.Count) else: row.cols.append("no count") # Web user logins rowcolquery = webquery.format(strMonthAgo, church[1]) data = q.QuerySql(rowcolquery) for i in data: if i.Count is not None: row.cols.append(i.Count) else: row.cols.append("no count") # Total unique login users rowcolquery = combinedquery.format(strMonthAgo, church[1], strMonthAgo, church[1]) data = q.QuerySql(rowcolquery) for i in data: if i.Count is not None: row.cols.append(i.Count) else: row.cols.append("no count") Data.rows.append(row) Data.header = Row("Logins: last 30 days") Data.header.cols.append("Mobile users") Data.header.cols.append("Web users") Data.header.cols.append("Combined (Unique)") template = ''' <script>document.title = 'Login Metrics'</script> <h3>Login Metrics</h3> <table border="1" class="table" style="width: auto"> <thead> <tr> <th>{{header.name}}</th> {{#each header.cols}} <th align="right">{{this}}</th> {{/each}} </tr> </thead> <tbody> {{#each rows}} <tr> <th>{{name}}</th> {{#each cols}} <td align="right">{{Fmt this "N0"}}</td> {{/each}} </tr> {{/each}} </tbody> </table> ''' print model.RenderTemplate(template) |
- Step 4
The default reporting period is the past 30 days. If you need to change this, modify the numbers on lines 4, 11, and 15. For example, to modify the report to cover the past 60 days, change the
30in these lines to60.- Step 5
Click the Run Script button at the top of the form. Then, if you want the report available on the Reports Menu, click the link at the bottom of the report - Add Report to Menu.
Latest Update |
11/13/2020 |
Modify image link with secure protocol.