Morning Worship Chart
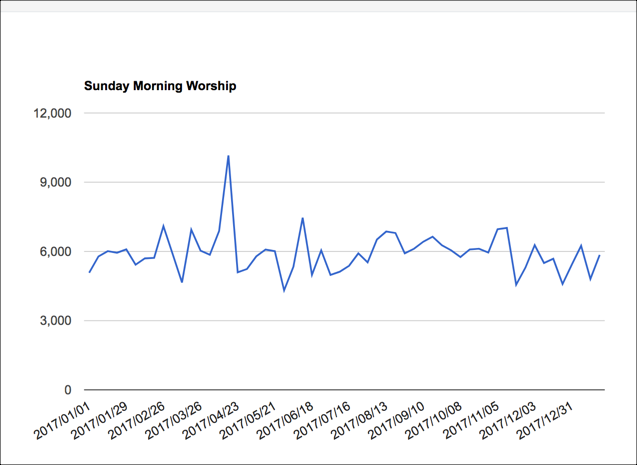
This Python script will create a line graph based on your church’s Sunday Morning Worship attendance. The graph will display each week’s meeting count.
Sample Report
Create Morning Worship Script
- Step 1
Go to Administration > Setup > Special Content and select the Python Scripts tab.
- Step 2
Click the green + New Python Script File button and enter the name of the file as
MorningWorshipand press Submit.- Step 3
Copy all of the code below and then paste it into the new script file and press the blue Save Python Script button.
- Step 4
Change the Program ID # from 1106 to whatever Program contains the Organizations where you capture your Worship attendance. This is on line 14 in the code.
WHERE d.OrgId = m.OrganizationId AND p.ProgId = 1106 )Also, you will need to make sure the start date is correct for the current year. See line 16 and note the date is 1/1/18. Change it to the start date for the 12 month period you want to report.
WHERE tt.hh > 1 AND tt.hh <= 12 AND ss >= '1/1/18' AND tt.HeadCount > 0
Note
You can find the Program ID # by going to Administration > Organizations > Programs. Use the ID# beside the Program you use for your Worship attendance.
- Step 5
Run the script and then click Add Report to Menu. This will put a link to the graph under Reports in the main menu.
model.Header = 'Morning Worship'

data = q.SqlNameCountArray("Sunday", '''
    SELECT CONVERT(VARCHAR, ss, 111) Name, SUM(HeadCount) Cnt
    FROM (
        SELECT
            HeadCount,
            dbo.SundayForDate(MeetingDate) ss,
            DATEDIFF(HOUR, dbo.SundayForDate(MeetingDate), MeetingDate) hh
        FROM dbo.Meetings m
        WHERE EXISTS(       SELECT NULL
                        FROM dbo.DivOrg d
                        JOIN dbo.ProgDiv p ON p.DivId = d.DivId
                        WHERE d.OrgId = m.OrganizationId AND p.ProgId = 1106 )
    ) tt
    WHERE tt.hh > 1 AND tt.hh <= 12 AND ss >= '1/1/18' AND tt.HeadCount > 0
    GROUP BY ss
    ORDER BY ss
''')

model.Script = '''
    <script type='text/javascript' src='https://www.google.com/jsapi'></script>
    <script type='text/javascript'>
      google.load('visualization', '1', {packages:['corechart']});
      google.setOnLoadCallback(drawChart);
      function drawChart() {
        var data = google.visualization.arrayToDataTable(@data);

        var options = {
          title: 'Sunday Morning Worship',
          legend: 'none',
          pieSliceText: 'label',
          slices: {  4: {offset: 0.2},
                    12: {offset: 0.3},
                    14: {offset: 0.4},
                    15: {offset: 0.5}
          },
        };

        var chart = new google.visualization.LineChart(document.getElementById('chart'));
        chart.draw(data, options);
      }
    </script>
'''.replace("@data", data)

print "<div id='chart' style='width: 900px; height: 500px;'></div>"
Latest Update |
11/13/2020 |
Modify image link with secure protocol.