Decreased Giving By Range Report
Note
This report is only available if your church uses the TouchPoint Giving payment gateway. Contact Tricia Fourman at Tricia.Fourman@touchpointsoftware.com to learn more about this option.
TouchPoint Giving reports are found under Finance > Reports under Reports in Column One. If your church uses the TouchPoint Giving payment gateway and you are unable to see the reports, send a request to TouchPoint Support to allow visibility.
Use the Decreased Giving by Range Report to identify those whose giving has decreased when comparing two time periods.
Filters include:
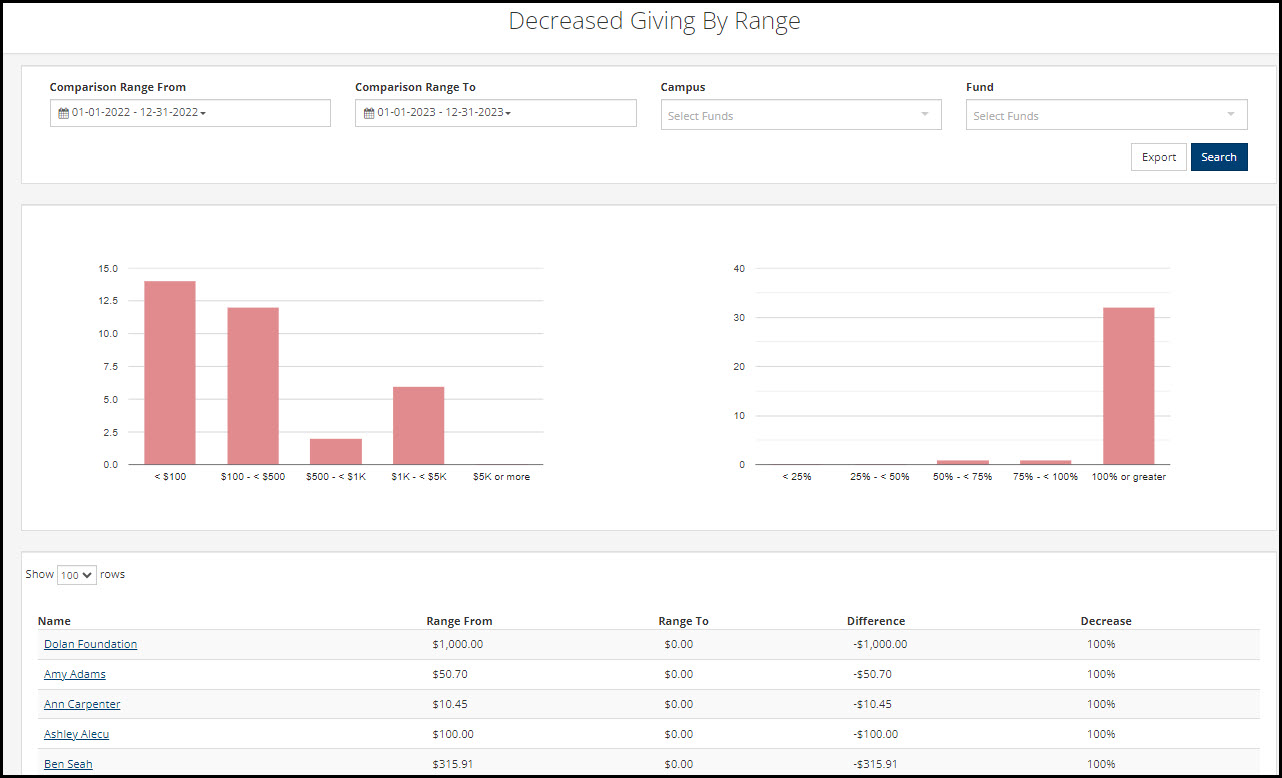
Range From / Range To: Define the time periods you would like to compare by entering the dates using the date picker or choose Today, Yesterday, This Month, This Year or Last Month. Range From defaults to Last Year. Range To defaults to This Year.
Campus: Narrow by campus of the giver. Campus list created through Lookup Codes. Leave blank to see all campuses including those with no campus assigned.
Fund: Select one or more funds to narrow your search or leave blank to view all funds.
Once you’ve set your parameters, click Search.
The first graph will represent how many givers (whose giving has decreased) had given within a certain range ($1 - $99, $100 - $499, etc) as represented by the Y axis. Hover on the graph to see the exact number of givers. The second graph shows how many people decreased their giving for a given percentage range (1% - 24%, 25% - 49%, etc).
Results can then be exported to Excel using the Export button at the top of the page near the filters. Additional actions can be taken on the results using the Blue Toolbar.
See also
Latest Update |
12/6/2023 |
Update range labels