Custom Reports
- Custom Reports
These reports can be built using a combination of fields that we have available ranging from personal data to family data to Involvement-specific data, as well as information relating to a person’s church membership status, extra values, and more.
Custom Reports can be created and run anywhere that the blue Toolbar is found, including Search Builder.
- Roles
Any user with the Admin or SpecialContentBasic role can create and edit Custom Reports.
Any user with the Access role can run Custom Reports.
- Restrictions
Custom Reports can be limited to just one Involvement. That is an option you have when creating or editing the report.
- Starter Reports
To get you started, we’ve provided two custom reports in each database: Email and Student and Parents. To create your own custom reports, complete the following steps.
Special Custom Report - Word Merge Docx
TouchPoint has another type of Custom Report that is created differently from those documented here. It is a Word Merge report. You can upload a document to use as a Word Merge and access it from the Blue Toolbar > code icon > Custom Reports.
See also
Create a Custom Report
- Step 1
Generate a list of individuals. You can do this from an Involvement, Search Builder, Tag, or wherever you see the Blue Toolbar.
- Step 2
Select the blue Toolbar > code icon > Custom Reports and then select New Custom Report beside the pencil icon.
- Step 3
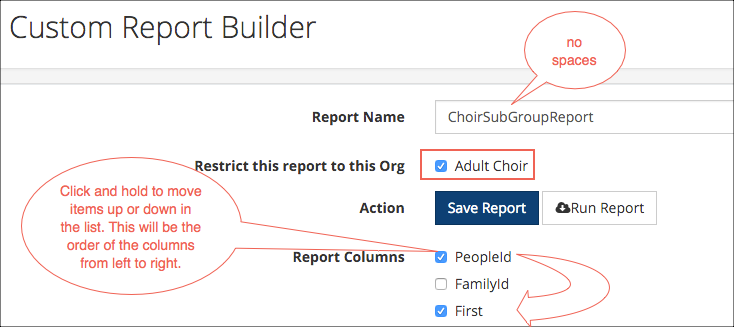
Enter a name for the report, using camel casing, no spaces, and nothing other than letters or numbers.
Report Names
You do not need to add spaces when naming your report. Just use camel casing (Example: MySpecialReport). When you see the name of the report on the toolbar, it will appear correctly spaced: My Special Report. In fact, if you include spaces in the name of the report, extra, unnecessary html (%20%) will be added to the URL for that report, which is not a good thing.
If you are creating this report from an Involvement page and you want to be able to run the report for only that one Involvement, check the box Restrict this report to the Involvement.
- Step 4
Select the items that you want to appear as columns on your report. Extra Values, Status Flags and Involvement specific Sub-Groups will display at the bottom of the list, and are identified in parentheses beside the item.
Order the Columns
You can order the columns anyway you prefer. Press (click) and hold an item, then drag and drop it where you want it - either up or down in the list. The order of the items in the list (top to bottom) will be the order (left to right) of the columns on the actual report.
- Step 5
Click the blue Save Report button. You see a prompt that is was successfully saved.
Note
After saving the report, all of the items that have been selected will be at the top of the list when viewing the report in edit mode.
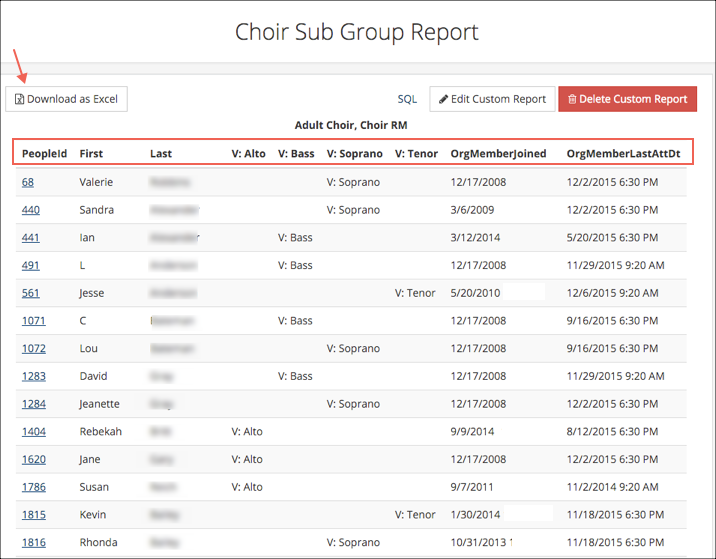
Now you can click Run Report. After running the report, you have the option to Download as Excel.
Your new report will now be available for any list of individuals where the Blue Toolbar is present, unless you elected to restrict it to a specific Involvement. In that case, the report will only display on the Toolbar for that Involvement.
See also
Sample Report
For the report below, four sub-groups were selected along with the People ID#, First Name, Last Name, and the Join and Last Attended Dates. However, there are a lot more fields available from which to choose.
Notice that the name of the applicable sub-group appears beside the person’s name under the correct column heading.
Users with the Admin or SpecialContentBasic role will see the Delete and Edit buttons. Those without those roles will not see them.
Run an Existing Custom Report
- Step 1
Find the list of people for whom you want the report. This can be an Involvement, a tag, a Search Builder results, or even a sub-set of members of a filtered Involvement.
- Step 2
Once you find the people, select the blue Toolbar > code icon > Custom Reports and then select the specific report you want.
- Step 3
The report will run as soon as you select it. Depending on how many columns the report has you may need to scroll to the right to view them all. If you want the report in Excel, click the Download as Excel button.
Edit an Existing Custom Report
- Step 1
Follow Steps 1 & 2 above to run the report.
- Step 2
Click the Edit Custom Report button at the top of the report.
- Step 3
Make any changes you need. Add extra fields by selecting them and then dragging them up or down to where you want them in the report. Uncheck any fields you do not need.
- Step 4
Click the blue Save Report button at the bottom of the page.
Note
If you need to delete a Custom Report, run the report, and then click the red Delete Custom Report button at the top of the report.
Spreadsheet of Basic Column Headers / Fields
Each database will have its own unique set of fields based on its Extra Values, Status Flags, and Involvement-specific sub-groups. But each database will contain the same basic fields. So, if you would like to see a list of those basic fields (along with a description) you can click here to download a spreadsheet containing those fields.
If you need a custom report, work with your System Admin or whoever has the SpecialContentBasic role for your TouchPoint database. They will be able to view all available fields in your database and can build the report for you.
Latest Update |
6/2/2023 |
Update terminology for Involvements